
My Energy Usage
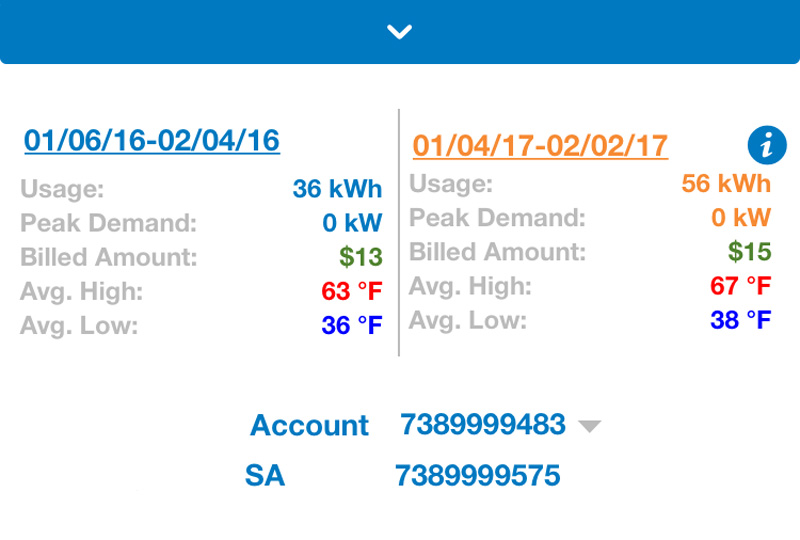
See detailed information about your energy use through My Account and the UES mobile app.
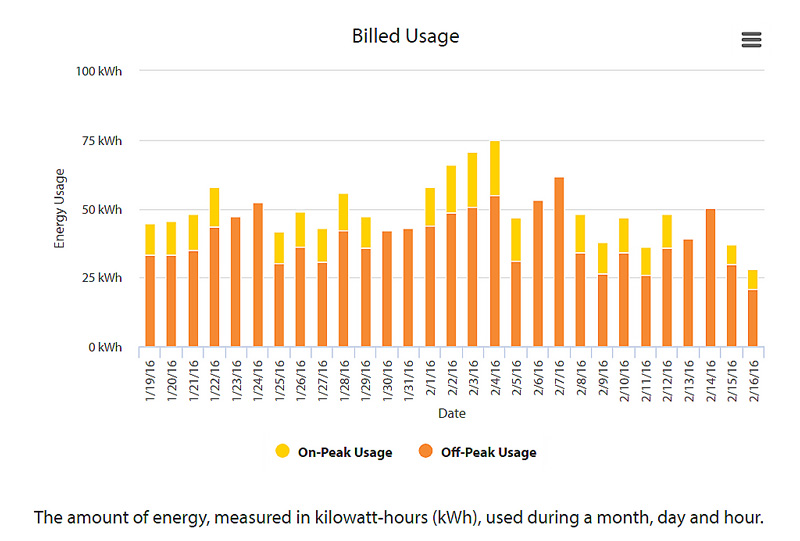
How much energy do you use each hour, day and month? Find out now through My Account under My Energy Usage and with the UES mobile app.
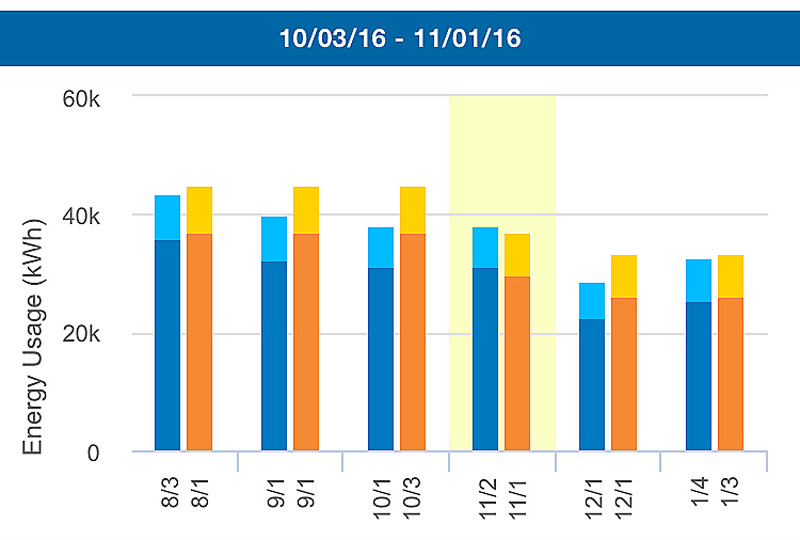
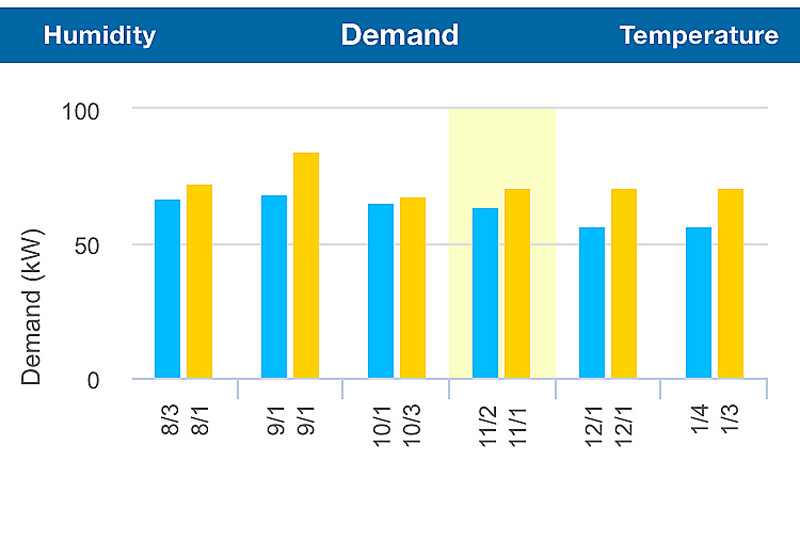
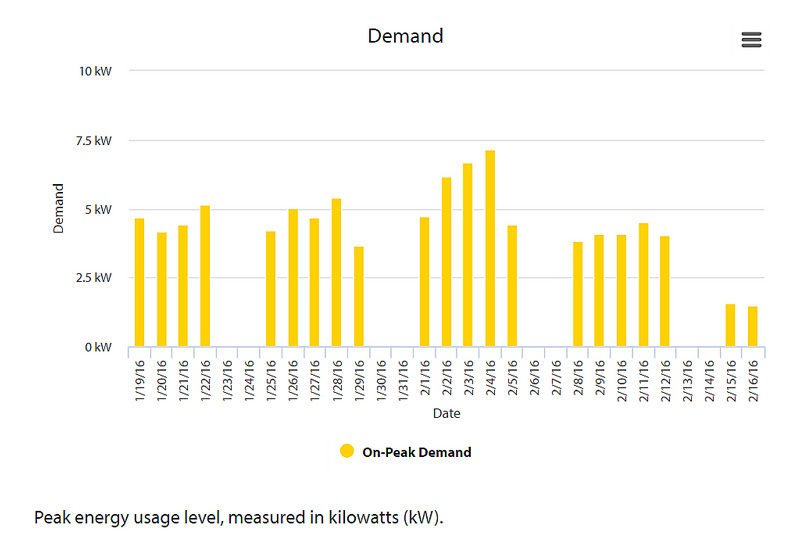
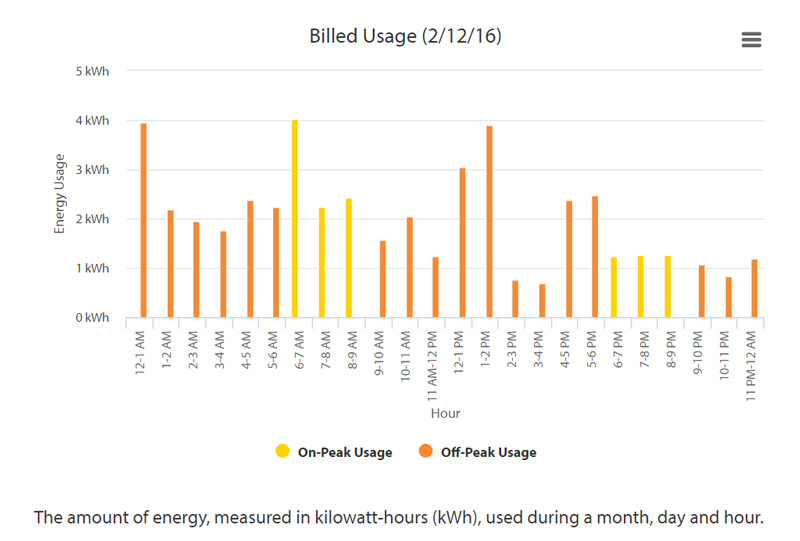
My Energy Usage displays detailed electric usage data, along with the outdoor temperature and humidity, which can impact your electric use and costs. You also can review your on-peak and off-peak usage and your “demand,” or peak level of usage.
Use this up-to-date information to learn more about your energy usage habits and to make informed choices about how to conserve energy and reduce your bill. You also can use it to help you choose the pricing plan that is right for you.
Screenshots
FAQs
Review your usage on uesaz.com using My Account or by using the UES mobile app. You must be a registered My Account user and log in to access your usage data.
- On the website, after logging in to My Account, scroll over Billing and Payment and then choose My Energy Usage.
- On the mobile app, after logging in, click the Usage tile.
View your hourly, daily and monthly electric use in kilowatt hours (kWh), along with your on-peak and off-peak usage in kWh. The graphs also display electric “demand,” or peak usage levels, in kilowatts (kW) during these time periods.
In addition, the graphs display the outdoor temperature and humidity during the selected time frames. These weather factors can impact your electric use.
- Usage: kWh used during an hour, month or day.
- Demand: Peak energy usage level, measured in kW. Demand is calculated based on the total number of kWh used during an hour.
- Temperature: Local outdoor temperature, which impacts energy consumption through the use of heating and cooling systems.
- Humidity: Local humidity readings. High humidity forces air conditioning systems and other equipment to work harder, driving up energy use.
Previously, only monthly usage data was available through My Account, the mobile app and on printed bills.
My Energy Usage provides you with up-to-date information about your electric use patterns – even before your monthly bill arrives. This information benefits you in multiple ways:
- Flexible viewing: Review your usage in hourly, daily or monthly intervals. By clicking on the bars in the graph or on the associated buttons, you can change the time periods for which usage and other associated data is displayed. Please note that you will not be able to drill down to the daily or hourly view if data from those periods is missing.
- Identify usage patterns: Reviewing daily and hourly usage can help you learn more about your electric usage patterns. With this knowledge, you can make informed choices about how to conserve energy and reduce your bill.
- Informs pricing plan selection: With My Energy Usage, you can review your on-peak and off-peak electric usage as well as your demand. Previously, this information was available only by calling Customer Care and speaking with a Customer Care Representative.
Reviewing on-peak usage and demand data can help you choose a pricing plan. Two of the new residential and Small General Service (SGS) plans incorporate time-of-use (TOU) rates with on-peak hours, while two plans include a demand component.
Commercial customers should consult a member of our Business Solutions team at 520-495-6333 before deciding to change pricing plans based on My Energy Usage information.
Yes, our website provides views that are unavailable on the mobile app.
On the website, you can check a box to see your on-peak and off-peak usage, even if you are not on a TOU pricing plan. This can help you determine if switching to a TOU plan might be right for you. Also, you can view your highest level of demand, both on-peak and off-peak.
On the app, only customers using our TOU or Demand TOU pricing plans can review their on-peak and off-peak usage. Residential customers can view their on-peak demand, regardless of their current pricing plan, but they cannot see their off-peak demand. Small General Service customers can review their on-peak demand, while Medium General Service and Large General Service customers can see their highest level of demand.
My Energy Usage displays energy use data as far back as January 1, 2017. Consistent hourly data readings from previous periods are unavailable. Eventually, you will be able to view 24 months of historical hourly and daily data.
The data is updated by TEP at least every 24 hours. Data updates are scheduled for the middle of each day.
Interval usage data is made available by automated electric meters that TEP has installed in recent years. Automated meters remotely transmit usage data through a wireless network.
Detailed usage data may not be available for certain hours or days due to network interference or other temporary conditions. In these cases, no information will display for the chosen time period. The data delivery system is relatively new, and UES is constantly working to refine and improve its performance.
Missing data will not affect your bill. Subsequent usage readings will be recorded, and the missing data will be interpolated.
In some cases, data displayed in My Energy Usage will not match information listed on your bill. This results from pairing new technology with an older billing system and UES' historic practice of rounding down consumption data to the nearest whole number for billing purposes.
UES' billing system does not accept decimal places. Because of this, usage data is rounded down to the nearest whole number. For example, a customer who uses 100.9 kWh of electricity would be billed for 100 kWh.
However, fractions of kWh or kW do contribute to the usage totals displayed in the My Energy Usage charts. This creates a discrepancy between displayed data and the figures used for billing purposes.
This discrepancy is larger for some commercial customers billed with a “multiplier” applied to usage figures that have been rounded down. Multipliers date back to the use of older electromechanical meters and helped reduce wear and tear on that equipment. When multipliers are added to rounded figures, a larger gap will exist between the displayed and the billed data.
No. If anything, our practice of rounding down consumption data for billing purposes results in billing customers for slightly less energy than they actually use.
Yes. For ease of use, My Energy Usage displays demand measured during clock-hours – from 3-4 p.m., for example. But customers can be billed based on demand from a different one-hour time period – such as 3:15-4:15 p.m. – that occurs during on-peak hours.
Because clock hours represent only a handful of the many one-hour periods that occur during on-peak hours, your demand probably will peak in some other one-hour period. For that reason, My Energy Usage is likely to display demand levels that are lower than your actual peak hourly demand, which is displayed accurately on your monthly bill.